In depth explanation of the JP40 cycle testing results
In the first set of JP40 in-house cycle testing, a pack of JP40 cells were load tested to a total of 151 cycles, capturing the average cell temp, voltage, and current.
The test still ongoing with more cycles to be posted soon.
Tests performed using a VESC based load tester at constant current. Open-source script and free build plans available here.
For the first set of intensive cycle testing, the JP40 was subjected to discharge current of 35a and a charge current of 6a.
With only 20 seconds of rest before charging to capture unloaded voltage and 30 sec rest after charging, these tests are performed back to back 24hrs a day.
Against All Odds
Before starting the 35a cycles, this set of cells was subjected to many extreme situations that we do not recommend you attempting such as:
Under voltage: all were dropped to 1v or lower twice.
Over voltage: Above 4.25v per cell for short periods.
Over temp: above 85c (labels turned black from the heat) while also under 1v
Additionally they were cycled at least 20 times a rates between 5a-45a, cycled at 30a while the cells were below 0C, and an additional 10 cycles at 30a at room temp.
I would say these 35a cycle results are the worse case scenario test results for the JP40.
We will rerun the tests again with new cells when these show serous aging, but so far they seem normal at a loss of about 0.9% capacity / 50 cycles.
With the tests performed on a 2 wire v sense (instead of 4 wire), the voltage and wh hours are "real-world" what you would see on your end application, not the best case scenario others report.

Cycle Charge Parameters
Charged to 4.175v/cell average then 350 second timer activated, which yields a consistent:
End of charge voltage of 4.195 before cut
20 sec after cut resting voltage of 4.165

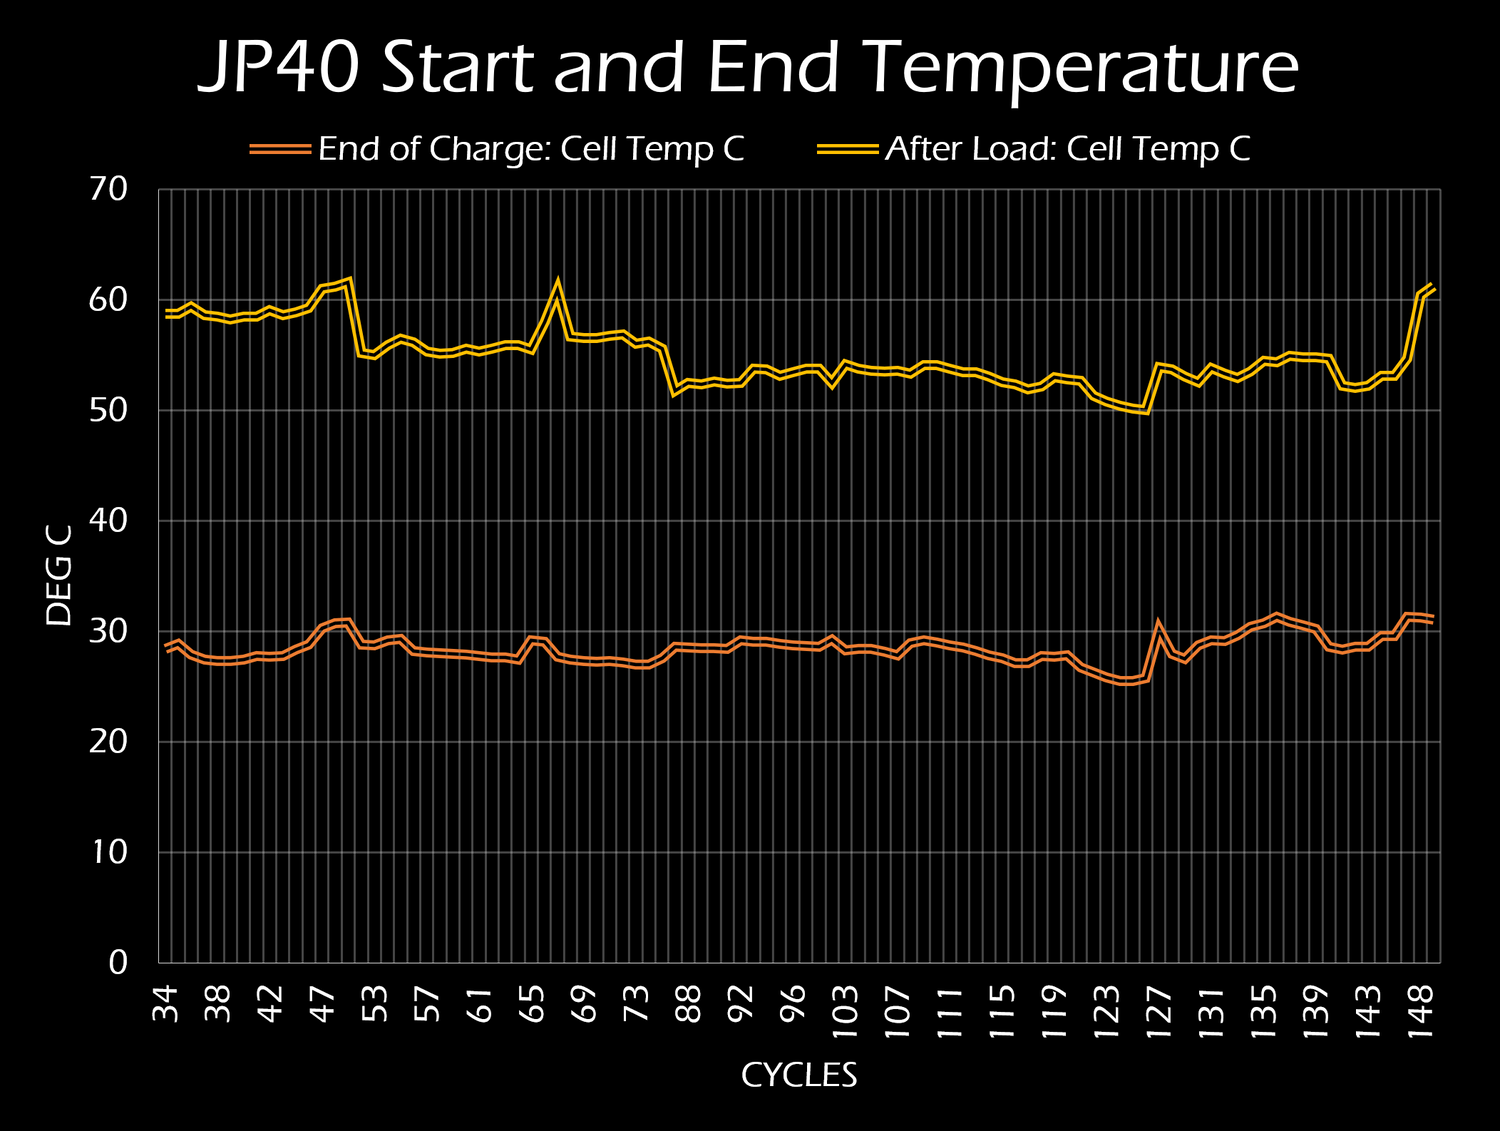
Cycle Thermals
During cycling an ambient temp of 20C to 25C was maintained.
1st, 50th, 100th, and 150th cycles at 23C ambient.
Sorry I don't have detailed thermal data before cycle 34 as that's when I added the code for it.
Why does cycle 1 start lower?
This is an interesting problem, because how does the tester know what duty cycle value to start the load
Duty cycle is roughly equivalent to the percentage of time the load is applied, approximately 50% duty = half the max current of 100% duty cycle.
The issue is that it's not easy to calculate what percentage of duty exactly will equal the desired load, so I would guess a close enough to run the first test.
On cycle 1 my guess was too high, so during the starting stage you can see this odd curve as the duty cycle is being reduced until the load current target is reached.
Essentially it was loading closer to 40a than the intended 35a and as a result pushing the voltage a bit lower than it would usually go.
I wasn't worried about this at the time because it would only skew the test scores lower and push the cell harder. By cycle 10 I had figured out the issue and worked out the correct starting duty cycle to match 35a load within a moment of start.

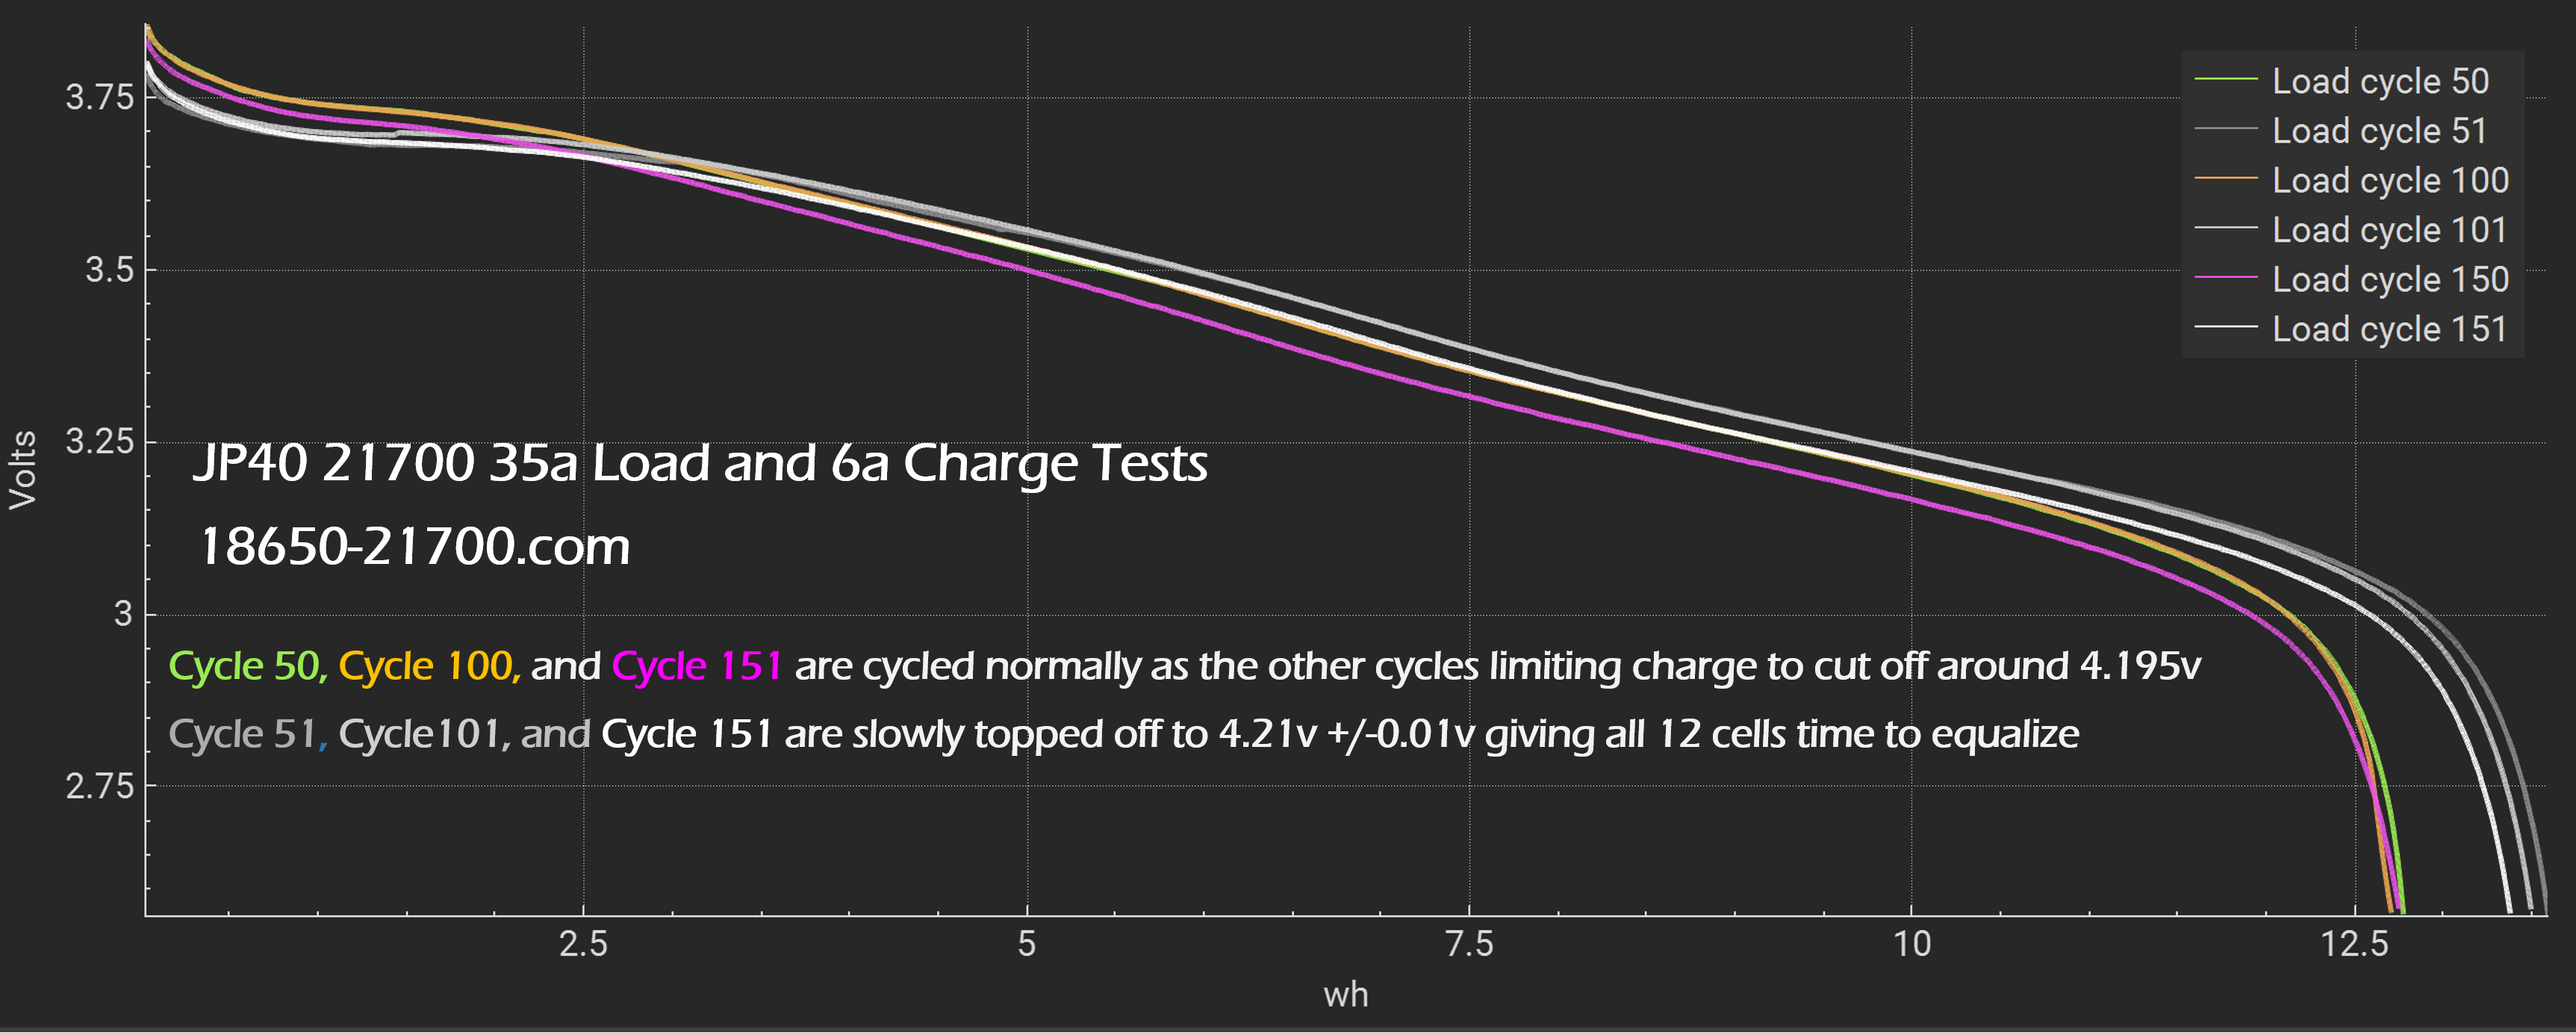
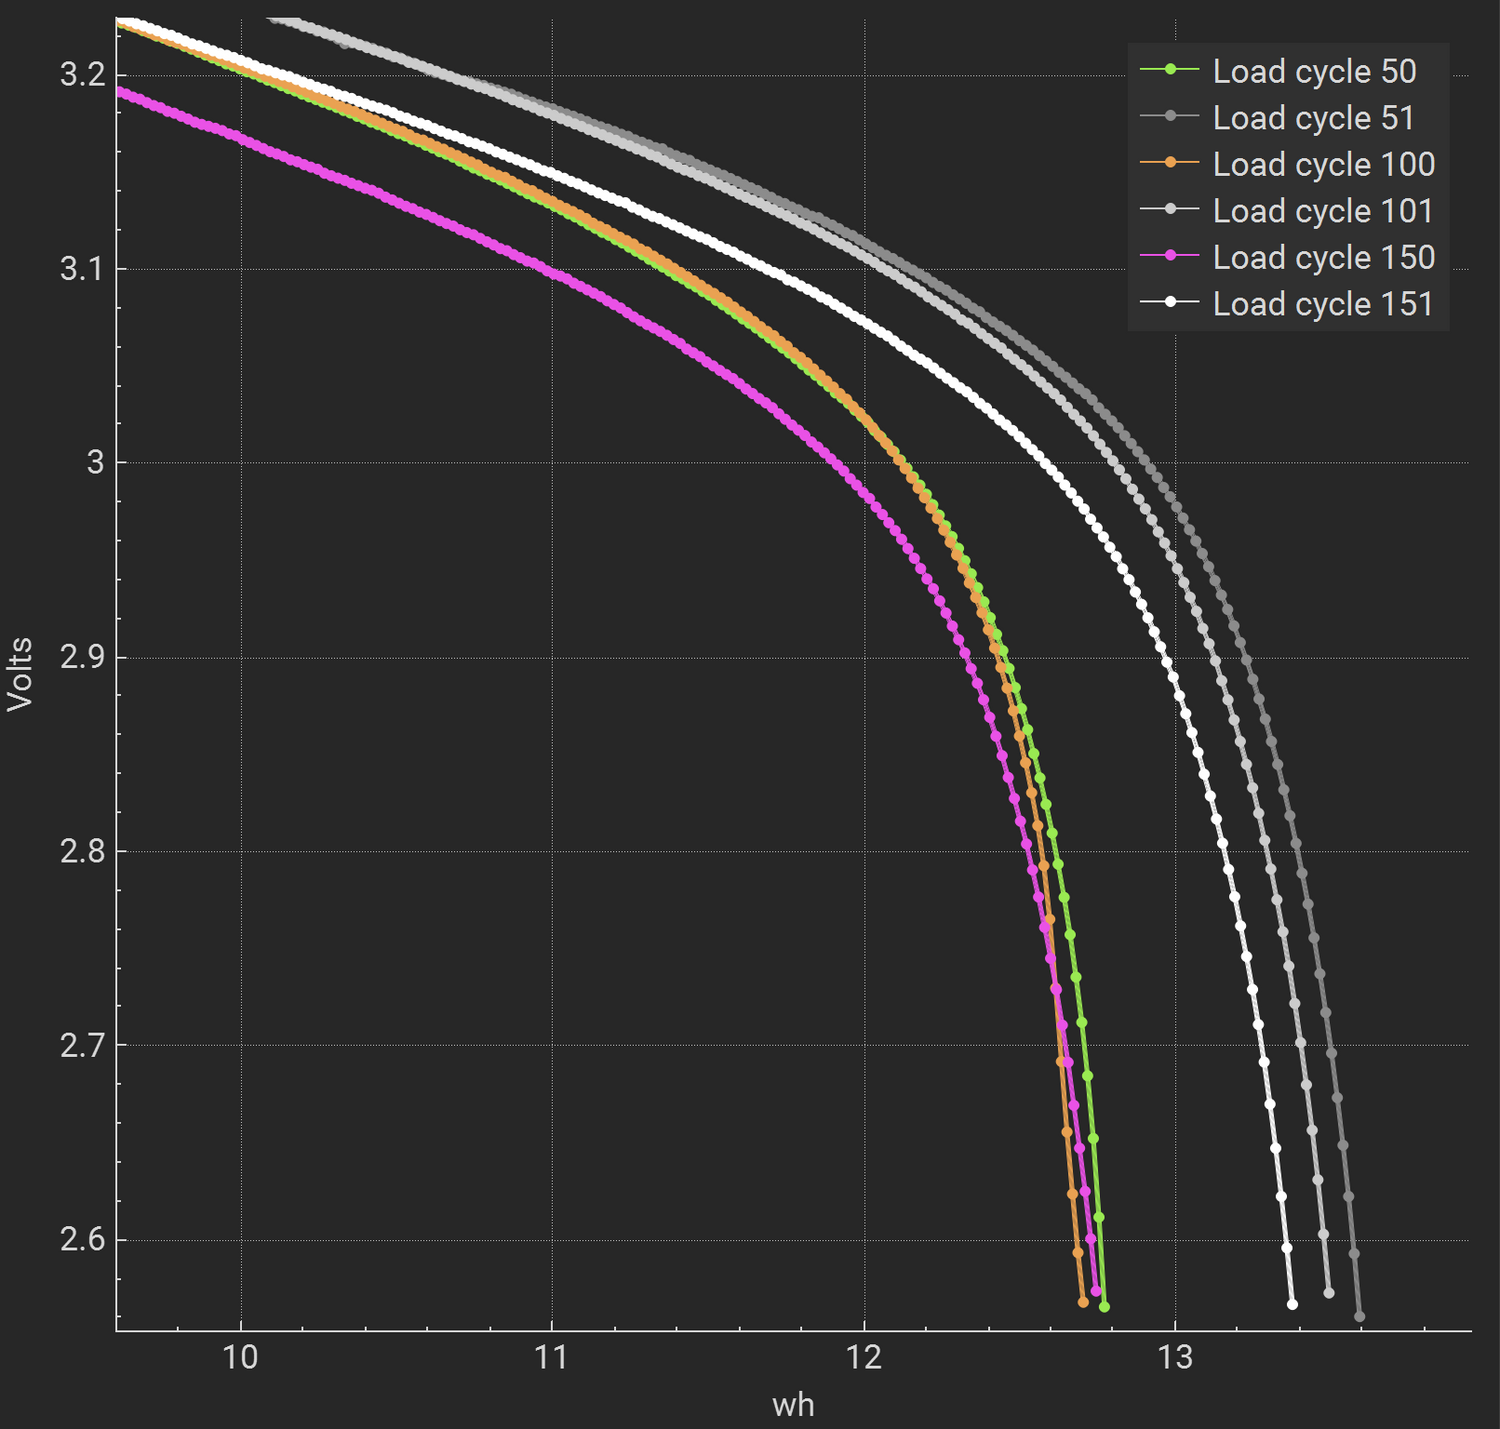
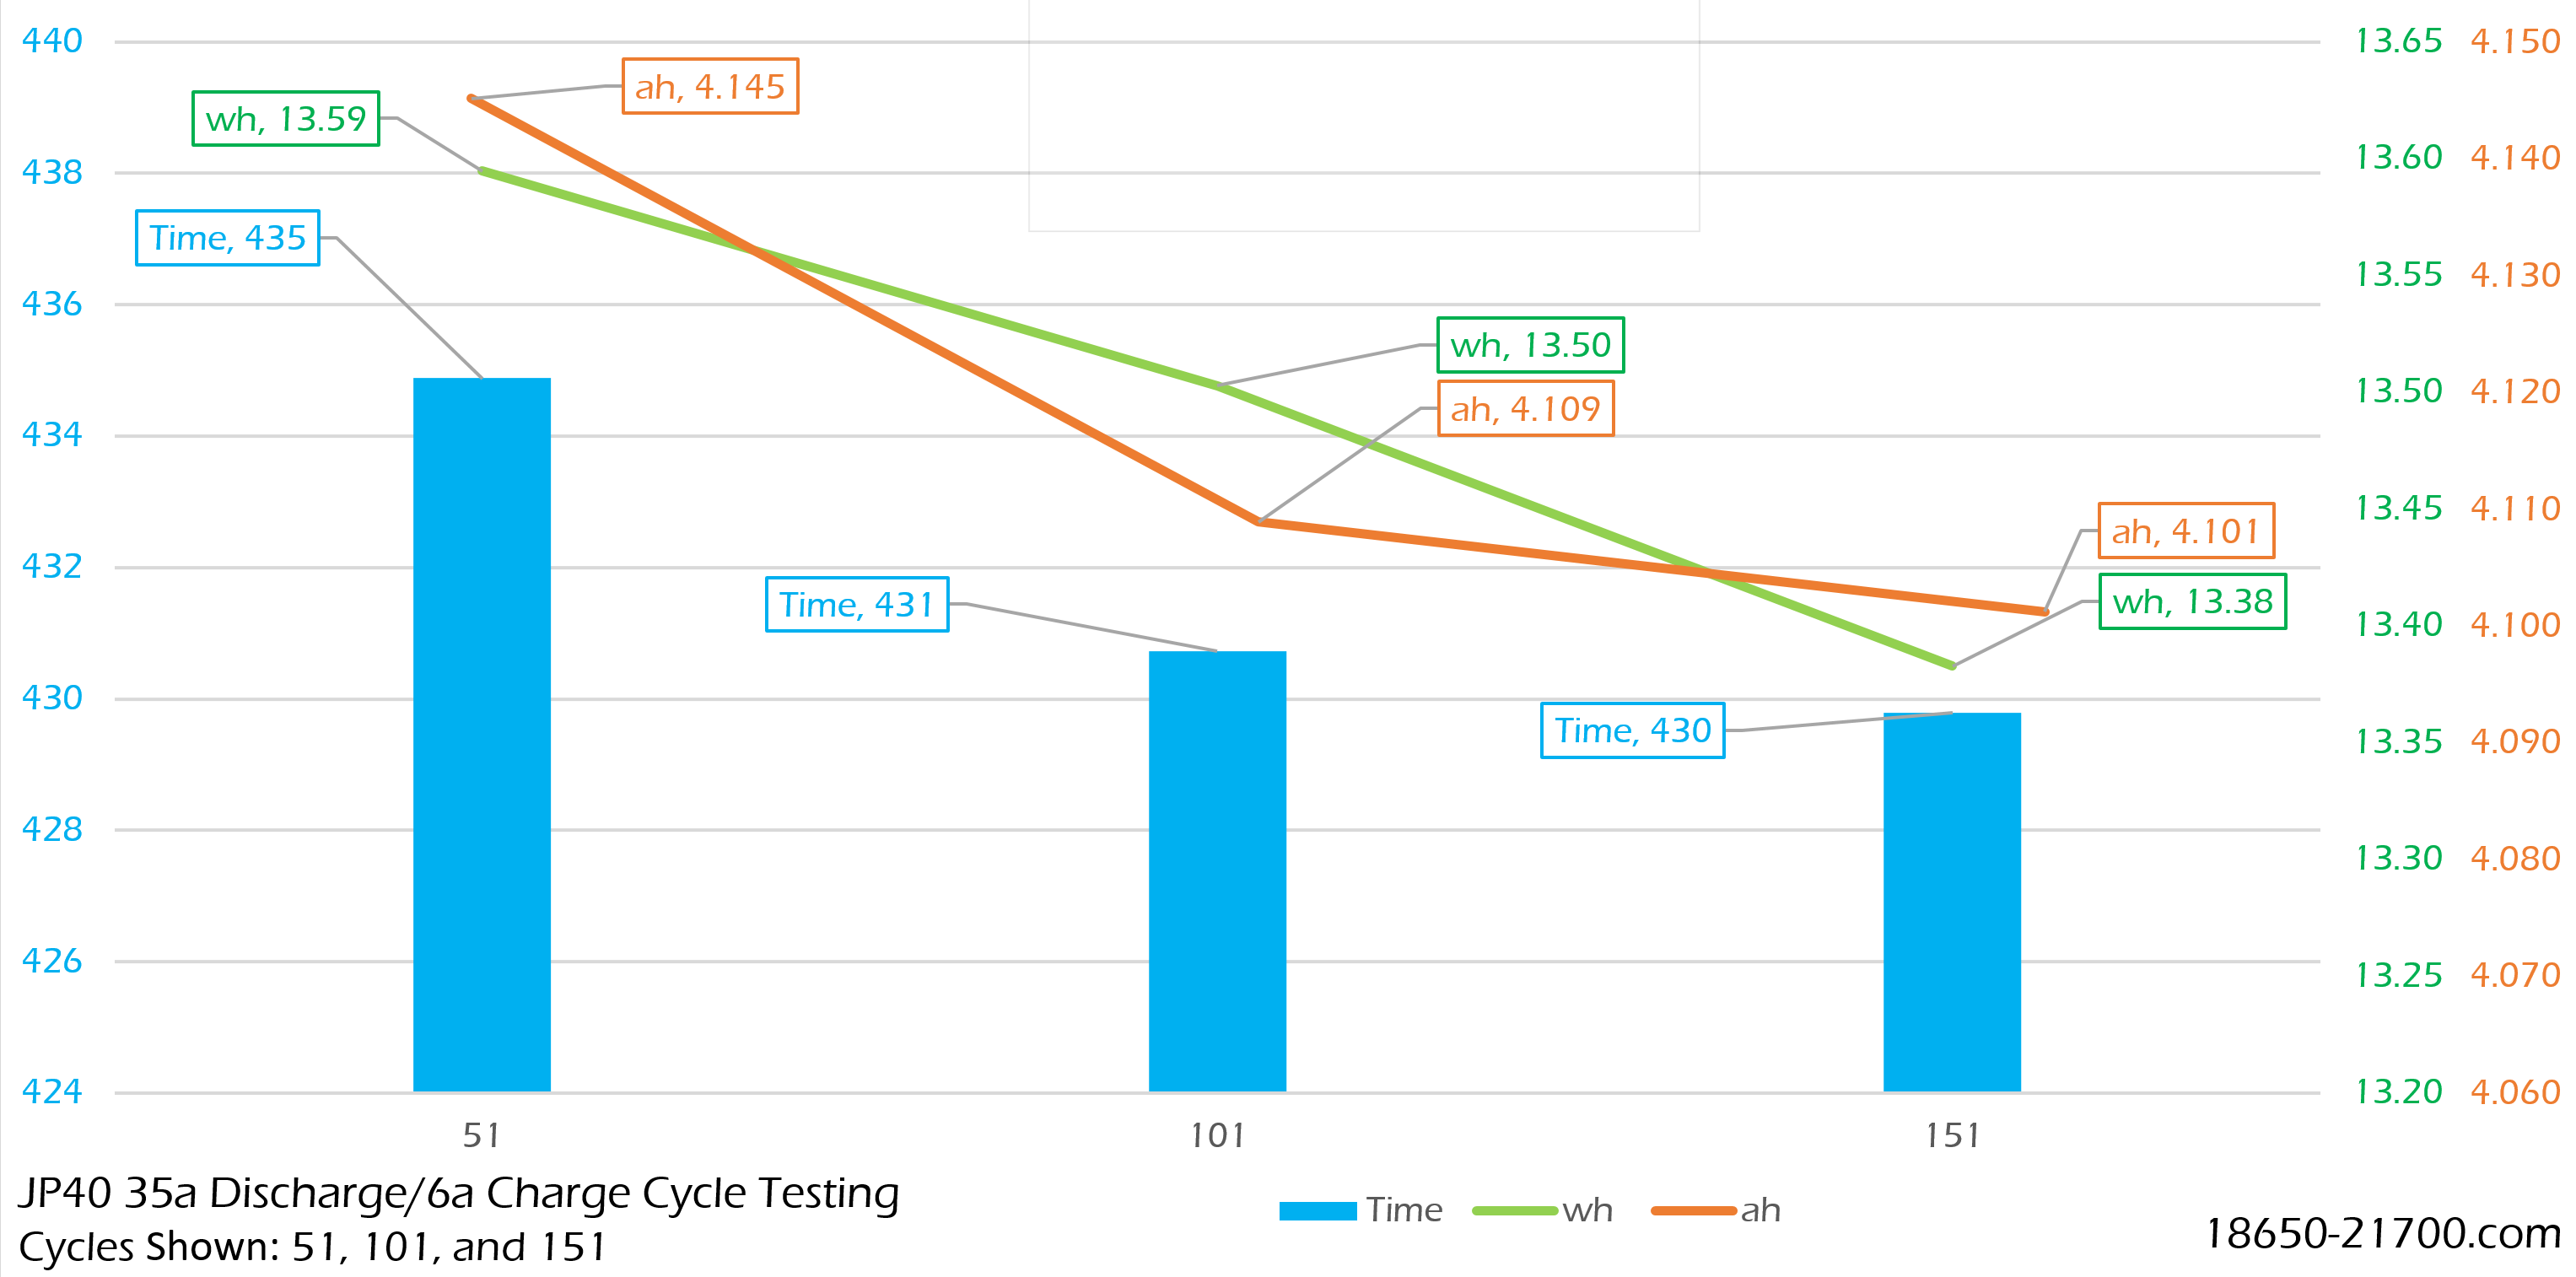
Comparing Full vs 96% Charged
The following graph shows the average cycles like 50, 100, and 150 which were charged to 96% of full capacity to the fully topped cycles 51, 101, and 151.


Pack Testing Factors
In this test while fast charging without fully topping off the cells, small imbalances become magnified meaning that there is some capacity that becomes unusable.
This doesn't stop the pack from delivering a fairly constant capacity after some threshold of imbalance is reached.
Knowing this I decided to terminate the charge cycle a bit conservatively which also reduced time of each cycle substantially to a mere 45 minutes including charge and discharge.
However I wanted to fully balance the cells every 50 cycles and see what their full capacity would be if I slow charged them to full.
On cycle 51, 101, and 151 I fully slow charged them and made sure all cells were +/- 0.01v in balance. (with a trend of the cells moving towards a more similar capacity as cycles progress, requiring less manual balancing at cycle 151 vs previous)
Cycles 85-95 Uniformity
We can see here that when the system is in automated testing the delivered energy cycle to cycle remains constant.
This represents a good example of the majority of cycles stress load.
Note the 2nd graph that is zoomed in at the start of cycles 85-95.

